people <- c("John", "Jane", NA)
id <- c(12, 27, 23)
df <- data.frame(id = id, person = people)18 Spreadsheets
Spreadsheets are a common way to communicate information to stakeholders. This chapter will go over how to export .xlsx and .csv files from R, how to format those spreadsheets, and how to add formulas to them.
18.1 Export
18.1.1 Export .csv Files
In order to export a dataframe to a CSV file, you can use the “write.csv” function. This function will accept a dataframe followed by the desired output location of your file. Let’s start by creating a sample dataframe to work with.
| id | person |
|---|---|
| 12 | John |
| 27 | Jane |
| 23 | NA |
Now, let’s specify the location we want to store the CSV file at and execute the “write.csv” function. (We use the file.path() to specify a path to the example.csv file in a temporary directory that will automatically be erased when your R session ends.)
output <- file.path(tempdir(), "example.csv")
write.csv(df, output)
This will give you a file that looks like the following image.
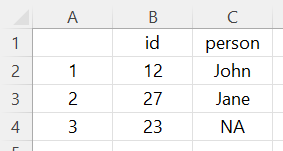
You’ll notice that the first column contains the row numbers of the dataframe. This can be remedied by setting “row.names” to “FALSE” as follows.
write.csv(df, output, row.names = FALSE)This will yield the following result.
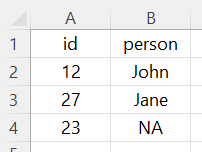
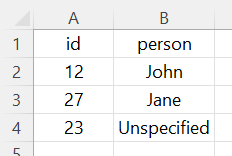
Finally, you’ll notice that one of the names is an “NA” value. You can tell R how to handle these values at the time of exporting your file with the “na” argument. This argument will replace any “NA” values with the value of your choice. Let’s try replacing the “NA” value with “Unspecified”.
write.csv(df, output, row.names = FALSE, na = "Unspecified")This results in the following output:
18.1.2 Export .xlsx Files
Excel files are handled very similarly to CSV files except that you will need to use the “write_excel” function from the “writexl” package. The following code snippet demonstrates how to export your data to an Excel file.
library(writexl)
output <- "C:/File Location/example.xlsx"
write_xlsx(df, output)
18.2 Formatting
When saving Excel workbooks, you can also leverage the “openxlsx” library to format and add formulas to your workbook. Let’s use the iris dataset to demonstrate these capabilities.
library(openxlsx)Next, let’s break down the iris dataset into three separate datasets based on species.
setosa <- iris[which(iris$"Species" == "setosa"),]
versicolor <- iris[which(iris$"Species" == "versicolor"),]
virginica <- iris[which(iris$"Species" == "virginica"),]
Now, we’ll use the “createWorkbook” function from the “openxlsx” library to create a blank workbook object.
wb <- createWorkbook()We’ll now add three worksheets to our workbook. These worksheets will ultimately be tabs in our Excel workbook.
addWorksheet(wb, "Setosa")
addWorksheet(wb, "Versicolor")
addWorksheet(wb, "Virginica")
We can also create styles to apply to our workbook. Let’s create a style for our headers as well as a style for the body of our data.
heading <- createStyle(fontName = "Segoe UI"
                        , fontSize = 12
                        , fontColour = "#FFFFFF"
                        , bgFill = "#244062"
                        , textDecoration = "bold")

body <- createStyle(fontName = "Segoe UI", fontSize = 12)
Let’s now apply our three datasets to the workbook object we previously created.
# Write the setosa dataset to the "Setosa" worksheet
writeData(wb
            , "Setosa"
            , setosa
            , startCol = 1
            , startRow = 1
            , rowNames = FALSE)

# Write the versicolor dataset to the "Versicolor" worksheet
writeData(wb
            , "Versicolor"
            , versicolor
            , startCol = 1
            , startRow = 1
            , rowNames = FALSE)

# Write the virginica dataset to the "Virginica" worksheet
writeData(wb
            , "Virginica"
            , virginica
            , startCol = 1
            , startRow = 1
            , rowNames = FALSE)
Now let’s apply our styles to each worksheet.
# Apply styles to "Setosa" worksheet
addStyle(wb
          , "Setosa"
          , cols = 1:length(setosa)
          , rows = 1
          , style = heading
          , gridExpand = TRUE)

addStyle(wb
          , "Setosa"
          , cols = 1:length(setosa)
          , rows = 2:nrow(setosa)
          , style = body
          , gridExpand = TRUE)

# Apply styles to "Versicolor" worksheet
addStyle(wb
          , "Versicolor"
          , cols = 1:length(versicolor)
          , rows = 1
          , style = heading
          , gridExpand = TRUE)

addStyle(wb
          , "Versicolor"
          , cols = 1:length(versicolor)
          , rows = 2:nrow(versicolor)
          , style = body
          , gridExpand = TRUE)

# Apply styles to "Virginica" worksheet
addStyle(wb
          , "Virginica"
          , cols = 1:length(virginica)
          , rows = 1
          , style = heading
          , gridExpand = TRUE)

addStyle(wb
          , "Virginica"
          , cols = 1:length(virginica)
          , rows = 2:nrow(virginica)
          , style = body
          , gridExpand = TRUE)
Finally, we will save our workbook to a file named “iris.xlsx”.
saveWorkbook(wb, "iris.xlsx", overwrite = TRUE)This will result in a workbook that looks like the following image.
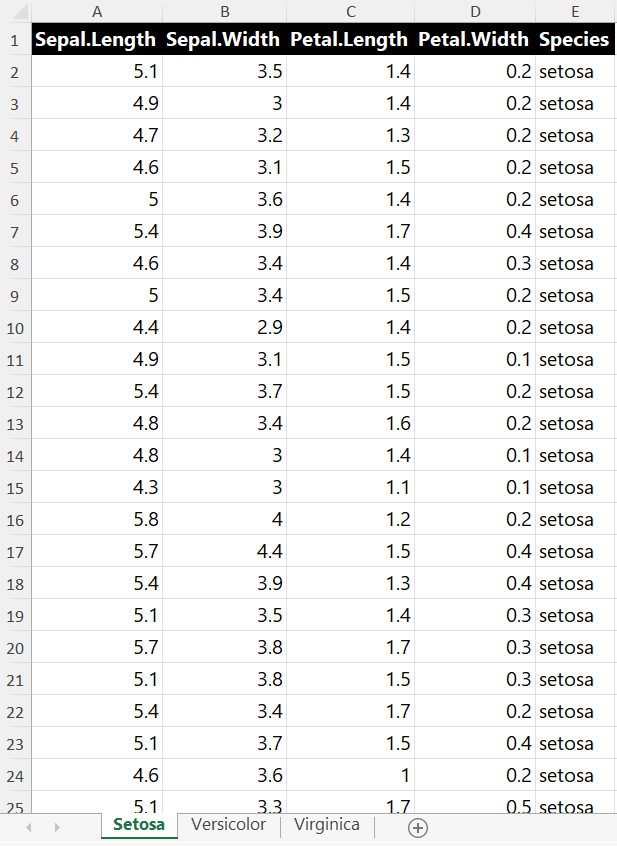
The full script is shown below.
library(openxlsx)

# Create datasets
setosa <- iris[which(iris$"Species" == "setosa"),]
versicolor <- iris[which(iris$"Species" == "versicolor"),]
virginica <- iris[which(iris$"Species" == "virginica"),]

# Create workbook object
wb <- createWorkbook()

#Add worksheets
addWorksheet(wb, "Setosa")
addWorksheet(wb, "Versicolor")
addWorksheet(wb, "Virginica")

# Create Styles
heading <- createStyle(fontName = "Segoe UI"
                       , fontSize = 12
                       , fontColour = "#FFFFFF"
                       , bgFill = "#244062"
                       , textDecoration = "bold")

body <- createStyle(fontName = "Segoe UI", fontSize = 12)

# Write the setosa dataset to the "Setosa" worksheet
writeData(wb
            , "Setosa"
            , setosa
            , startCol = 1
            , startRow = 1
            , rowNames = FALSE)

# Write the versicolor dataset to the "Versicolor" worksheet
writeData(wb
            , "Versicolor"
            , versicolor
            , startCol = 1
            , startRow = 1
            , rowNames = FALSE)

# Write the virginica dataset to the "Virginica" worksheet
writeData(wb
            , "Virginica"
            , virginica
            , startCol = 1
            , startRow = 1
            , rowNames = FALSE)

# Apply styles to "Setosa" worksheet
addStyle(wb
          , "Setosa"
          , cols = 1:length(setosa)
          , rows = 1
          , style = heading
          , gridExpand = TRUE)

addStyle(wb
          , "Setosa"
          , cols = 1:length(setosa)
          , rows = 2:nrow(setosa)
          , style = body
          , gridExpand = TRUE)

# Apply styles to "Versicolor" worksheet
addStyle(wb
          , "Versicolor"
          , cols = 1:length(versicolor)
          , rows = 1
          , style = heading
          , gridExpand = TRUE)

addStyle(wb
          , "Versicolor"
          , cols = 1:length(versicolor)
          , rows = 2:nrow(versicolor)
          , style = body
          , gridExpand = TRUE)

# Apply styles to "Virginica" worksheet
addStyle(wb
          , "Virginica"
          , cols = 1:length(virginica)
          , rows = 1
          , style = heading
          , gridExpand = TRUE)

addStyle(wb
          , "Virginica"
          , cols = 1:length(virginica)
          , rows = 2:nrow(virginica)
          , style = body
          , gridExpand = TRUE)

saveWorkbook(wb, "iris.xlsx", overwrite = TRUE)
You may notice that this script is a little longer than it needs to be. Let’s try to simplify it with a loop.
The following script will accomplish the exact same thing as the first script.
library(openxlsx)

setosa <- iris[which(iris$"Species" == "setosa"),]
versicolor <- iris[which(iris$"Species" == "versicolor"),]
virginica <- iris[which(iris$"Species" == "virginica"),]

wb <- createWorkbook()

heading <- createStyle(fontName = "Segoe UI"
                       , fontSize = 12
                       , fontColour = "#FFFFFF"
                       , bgFill = "#244062"
                       , textDecoration = "bold")

body <- createStyle(fontName = "Segoe UI", fontSize = 12)

datasets <- list(setosa, virginica, versicolor)
worksheets <- c("Setosa", "Virginica", "Versicolor")

for (i in 1:3) {
  df <- as.data.frame(datasets[i])
  addWorksheet(wb, worksheets[i])
  writeData(wb
              , worksheets[i]
              , df
              , startCol = 1
              , startRow = 1
              , rowNames = FALSE)
  addStyle(wb
            , worksheets[i]
            , cols = 1:length(df)
            , rows = 1
            , style = heading
            , gridExpand = TRUE)
  addStyle(wb
            , worksheets[i]
            , cols = 1:length(df)
            , rows = 2:nrow(df)
            , style = body
            , gridExpand = TRUE)
}

saveWorkbook(wb, "iris.xlsx", overwrite = TRUE)
18.3 Formulas
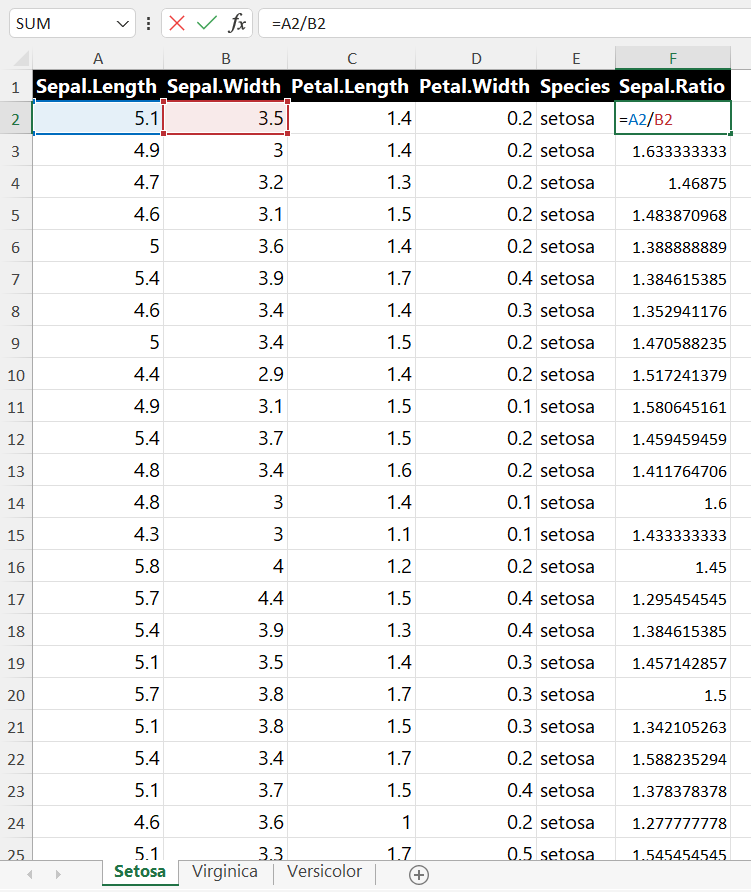
If we wanted to add another column to each of our worksheets that used an Excel formula to determine the ratio between the sepal length and the sepal width, we could use the “writeFormula” function to accomplish that.
The following example uses a loop that creates a formula for each row which divides the respective value in column A by the the respective value in column B. Next we add the heading style to the first row in column six and add a header named “Sepal.Ratio”. Finally, we write the formula vector to column six beginning on row 2.
library(openxlsx)

setosa <- iris[which(iris$"Species" == "setosa"),]
versicolor <- iris[which(iris$"Species" == "versicolor"),]
virginica <- iris[which(iris$"Species" == "virginica"),]

wb <- createWorkbook()

heading <- createStyle(fontName = "Segoe UI"
                       , fontSize = 12
                       , fontColour = "#FFFFFF"
                       , bgFill = "#244062"
                       , textDecoration = "bold")

body <- createStyle(fontName = "Segoe UI", fontSize = 12)

datasets <- list(setosa, virginica, versicolor)
worksheets <- c("Setosa", "Virginica", "Versicolor")

for (i in 1:3) {
  df <- as.data.frame(datasets[i])
  addWorksheet(wb, worksheets[i])
  writeData(wb
            , worksheets[i]
            , df
            , startCol = 1
            , startRow = 1
            , rowNames = FALSE)
  addStyle(wb
            , worksheets[i]
            , cols = 1:length(df)
            , rows = 1
            , style = heading
            , gridExpand = TRUE)
  addStyle(wb
            , worksheets[i]
            , cols = 1:length(df)
            , rows = 2:nrow(df)
            , style = body
            , gridExpand = TRUE)

  formula <- c()

  for (x in 2:(nrow(df) + 1)) {
    formula <- append(formula, paste("A", x, "/B", x, sep = ''))
  }

  addStyle(wb
            , worksheets[i]
            , cols = 6
            , rows = 1
            , style = heading
            , gridExpand = TRUE)
  writeData(wb
              , worksheets[i]
              , "Sepal.Ratio"
              , startCol = 6
              , startRow = 1
              , rowNames = FALSE)
  writeFormula(wb
                , worksheets[i]
                , formula
                , startCol = 6
                , startRow = 2)

}

saveWorkbook(wb, "iris.xlsx", overwrite = TRUE)
This gives us an Excel workbook that looks like the following image.
18.4 Resources
- openxlsx documentation: https://cran.r-project.org/web/packages/openxlsx/openxlsx.pdf